ADF Performance Monitor brings performance improvements and insight at Intris
Intris is the leading Belgian provider of freight forwarding, customs and warehousing management solutions. Headquartered in Antwerp, Intris provides its integrated software and cloud-based solutions to logistics services providers in Belgium and the Netherlands.
Klant
Intris

Markt
Zakelijke dienstverlening
Publicatiedatum
19 februari 2021


Ben Rombouts is Chief Operating Officer at Intris. Recently he has written a detailed review on the ADF Performance Monitor - a tool Intris uses for monitoring the performance of their large Oracle ADF application.
FOR WHAT AND HOW THE ADF PERFORMANCE MONITOR IS USED THE ADF
Performance Monitor is used within our development team as an extra quality check when building new functionalities. After developing the code, the developers carry out their test scenarios and check the results based on the metrics generated by the tool. With this, non-performing queries are instantly removed, and we get a better insight where we need to work on additional performance improvements.
Since our standard application consists of several modules, our customers do not use all functionalities in the same way, or equally frequently. That is why the tool is also used for many LIVE customers in production, considering the following parameters:
- Number of users
- Type of hardware that the application runs on
- Functionalities used by the customer

Our account managers use the data in different ways and base themselves mainly on the dashboard:
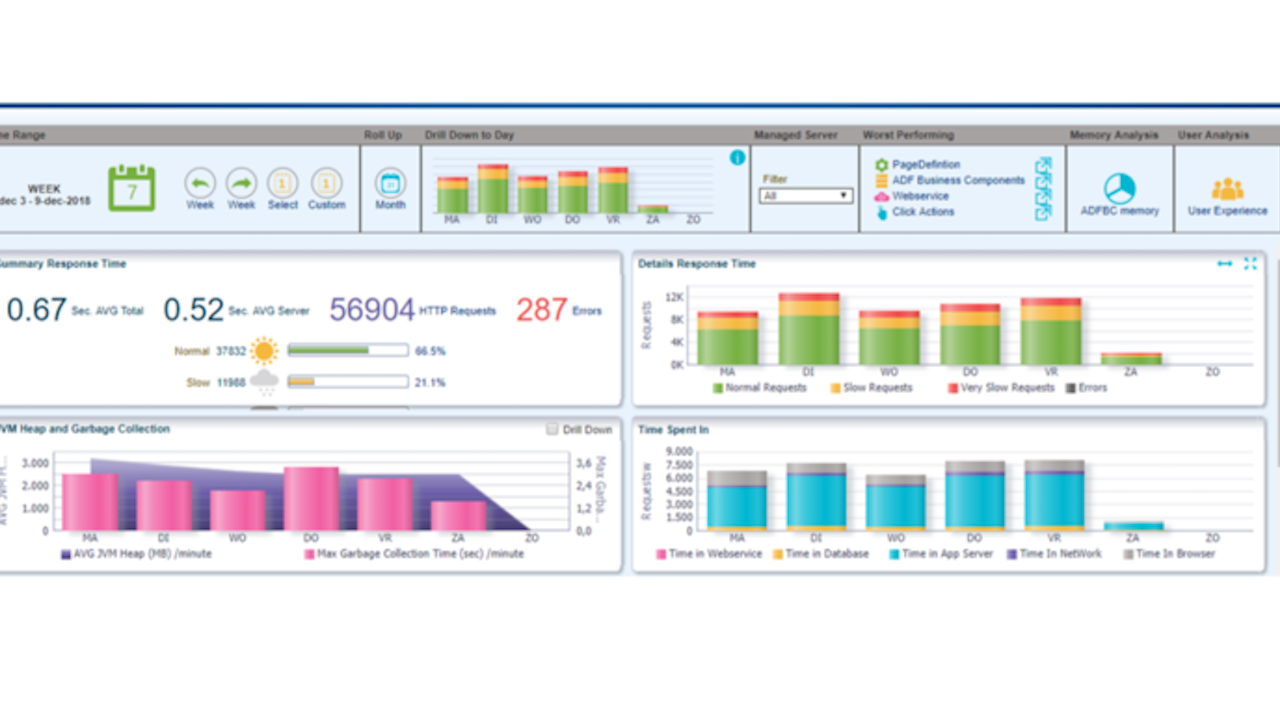
- General information about the average response time to give a correct indication of the performance during steering committee meetings. Previously there was much more subjectivity here (type "Every action takes seconds in your application"). This has ensured that these discussions are over now and that we can focus on the real issues.
- Errors that are reported. These are split into effective technical errors and errors that are of a more functional nature. This also gives a good impression of the fact that some users make the same mistakes and so there is a need for additional training. The technical errors are made into issues that are passed on to the development team and, depending on the importance, included in new releases.
- Discussions about what the performance issues are related to. Since we enable the tool at different clients on different platforms, we can also compare this over the environments. For example, we can see that the database time is always a constant, but that there are variations in network and browser time. This can then be addressed to the system administrator of the customer.
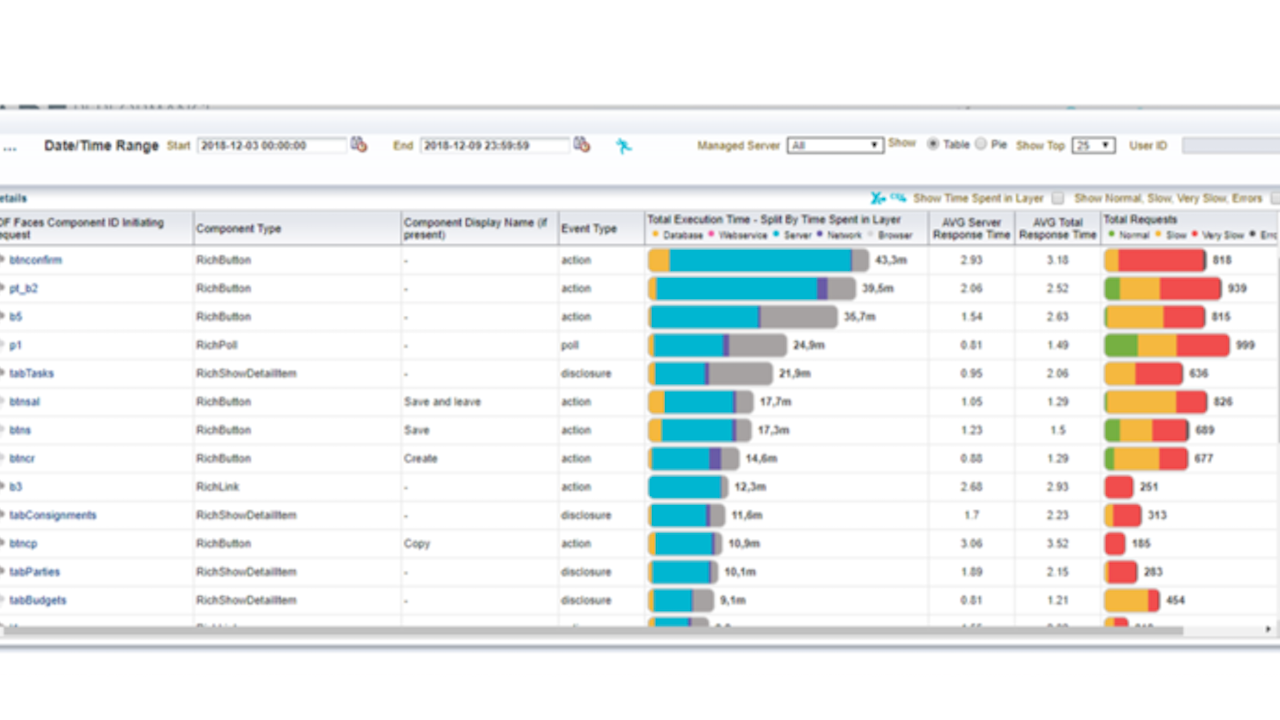
- From the "ADF click actions" we also get very useful information about the specific use of our application:
- which actions last the longest?
- which actions are carried out most frequently?
- which users experience the most problems?
This makes it much more convenient to focus on the real problems and clearly report to the customer why we focus on certain matters, and why we give other things a lower priority.

At frequent intervals we also try to go through several environments with a senior developer to check more technical problems that can be improved in the application. Sometimes, for example, if we notice things at a customer where certain actions take longer and longer, so there is a problem in the queries. Other customers do not have any problems with this now, for example because they have less data, but in the future, they will not run into this type of problem because we can take them pro-actively from the application.
HOW THE ADF PERFORMANCE MONITOR HELPED
- The tool mainly helped us to view things in an objective way. For example, some actions in the application can take quite a long time for an end-user but are only executed 2-3 times a week. If we put this in perspective in relation to actions that are carried out 100 times a day, it is already much clearer where you need to focus.
- When customers report certain errors via our support, we can consult logging much faster because we can see very quickly which actions were performed by which user at that specific moment.
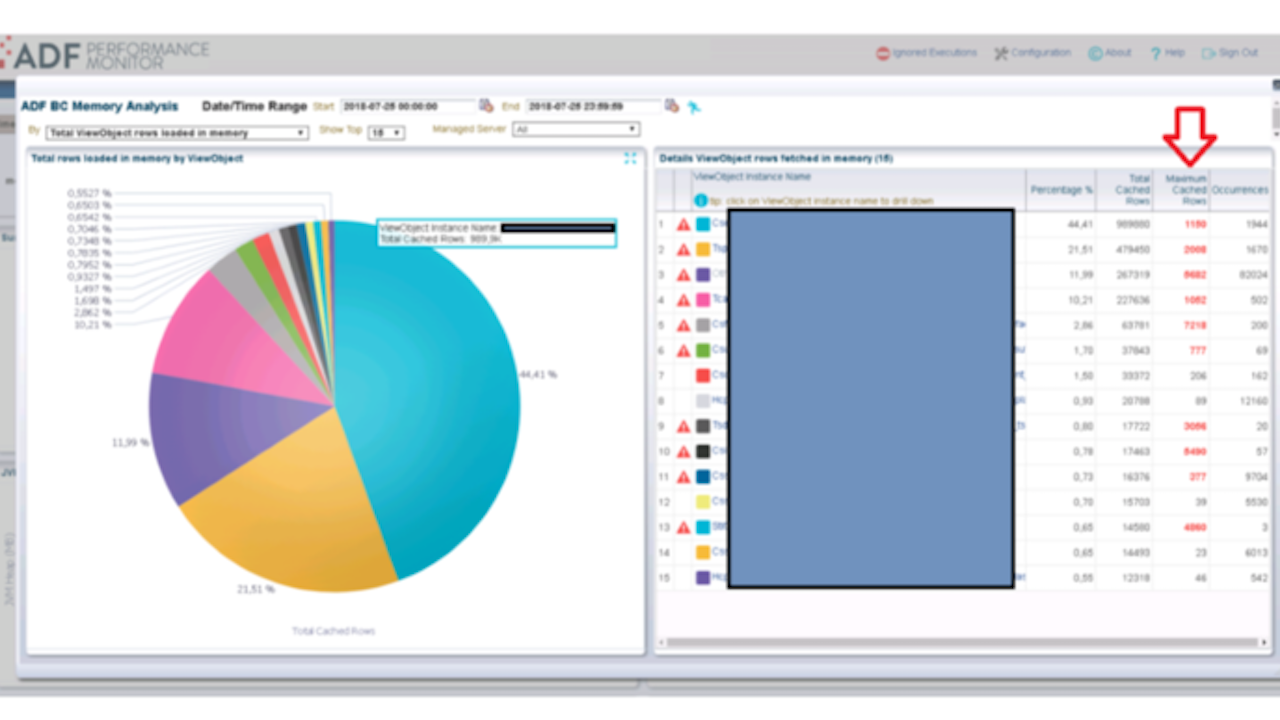
- From the overview ADFBC memory overview you can quickly find out where there are any problems in queries. These are issues that are sometimes not noticed by customers, but where you can prevent problems in a proactive way.
- The tool also gave us a much clearer and more objective insight into the use of the application. This is rather a ‘side effect’ of using the tool, but it gives a quick and clear overview to prepare steering committees for reporting.

HOW THE ADF PERFORMANCE MONITOR SAVED MUCH TIME (AND MONEY)
To express this in time/money is quite difficult, but you can safely say that you can win a lot of time in the following areas:
- 50-60% time savings for researching performance-related issues. Because developers really get a very low-level insight into the framework, it is much easier to tackle performance issues and generate large performance profits with limited actions
- 5-10% time savings by incorporating extra quality checks in development cycle (time gains come from avoiding hotfixes)
- 20-30% time saving when investigating errors reported by customers.
- Great time gain during steering committees to keep the subjectivity out of the discussions so that there can be focused on the actions that really matter to end users. For example, a manager can complain that he does a certain action 2 or 3 times a week which takes him about 5 minutes per action. If you put a workload of 1 day in improving this specific action you can decrease the time to 2 minutes, which is a 60% time gain for this specific action. This will save 6-9 minutes each week, but just for 1 person. Compare this to an action that 20 end users are executing each day for more than 100 times. They don’t complain about it, but with the same effort of 1 day workload we can improve this action with “only” 2 seconds. This will gain you more than 20.000 seconds or 333 minutes each week!! In this way you can put things in a broader context and convince customers where they will really gain time.
Ook interessant:
Meer weten hierover?
Neem contact op met Robbrecht

Robbrecht van Amerongen